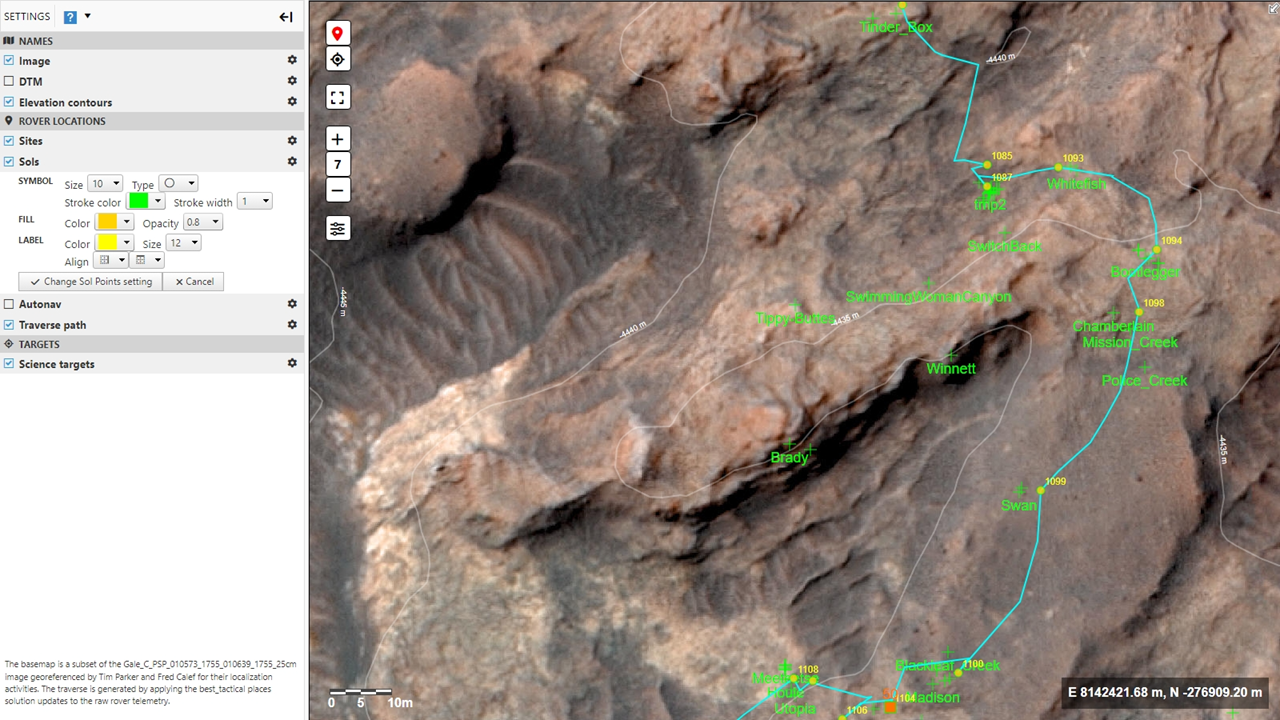
Traverse map
APOApplies to the
Apollo ANM20Applies to the
Mars 2020 ANMERApplies to the
MER ANMSLApplies to the
MSL AN
The traverse map shows the rover's movement over time in context of the broader area. The science team has Use the traverse map to find data based on location. See this deep dive for details on rover locations and how they are derived.
What the map shows
Mars rover traverses are plotted on an Mars Reconnaissance Orbiter HiRISE base map. Annotations show locations where data were acquired. Sol numbers are shown beside some markers. (Autonav images that support driving and intermediate long-term data collection products are not included in establishing these locations.)
The Apollo traverses are plotted on Lunar Reconnaissance Orbiter LROC high-resolution controlled mosaics and show stations, instruments, and sample collection locations.
Moving around the map
You can move around the maps several ways.
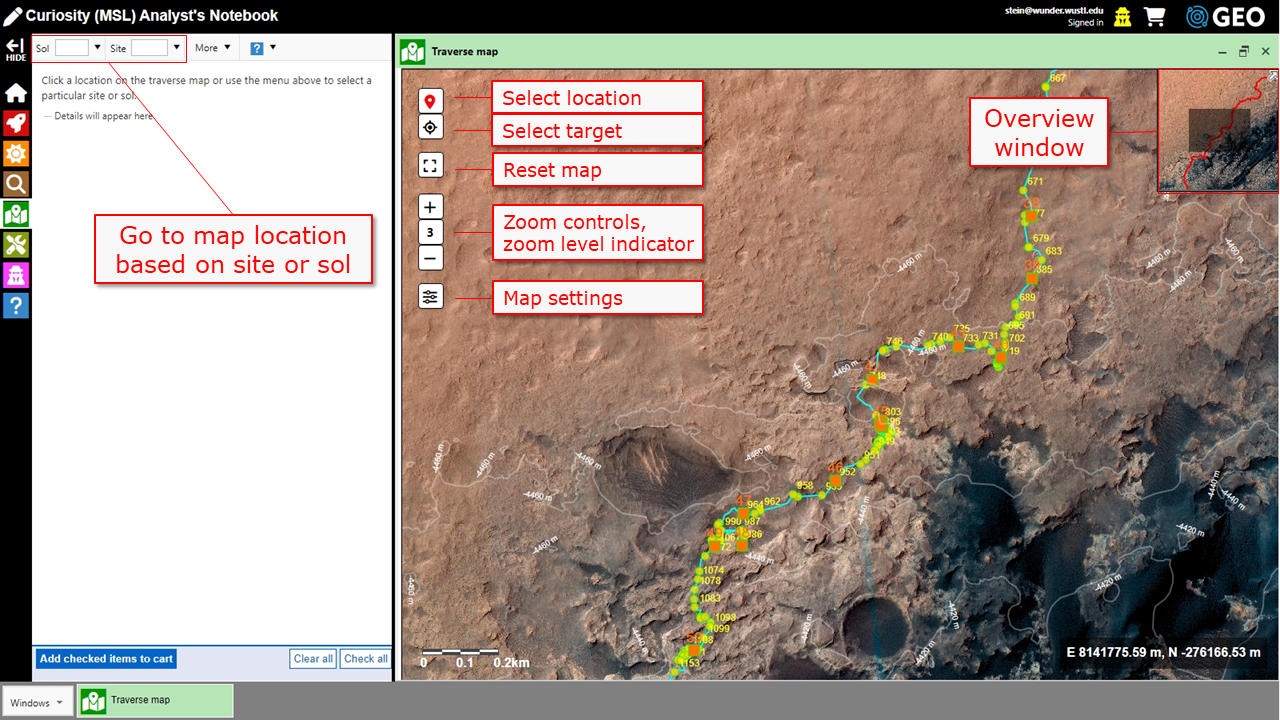
- Use your mouse to zoom and pan around the map.
- Use the controls in the upper left corner.
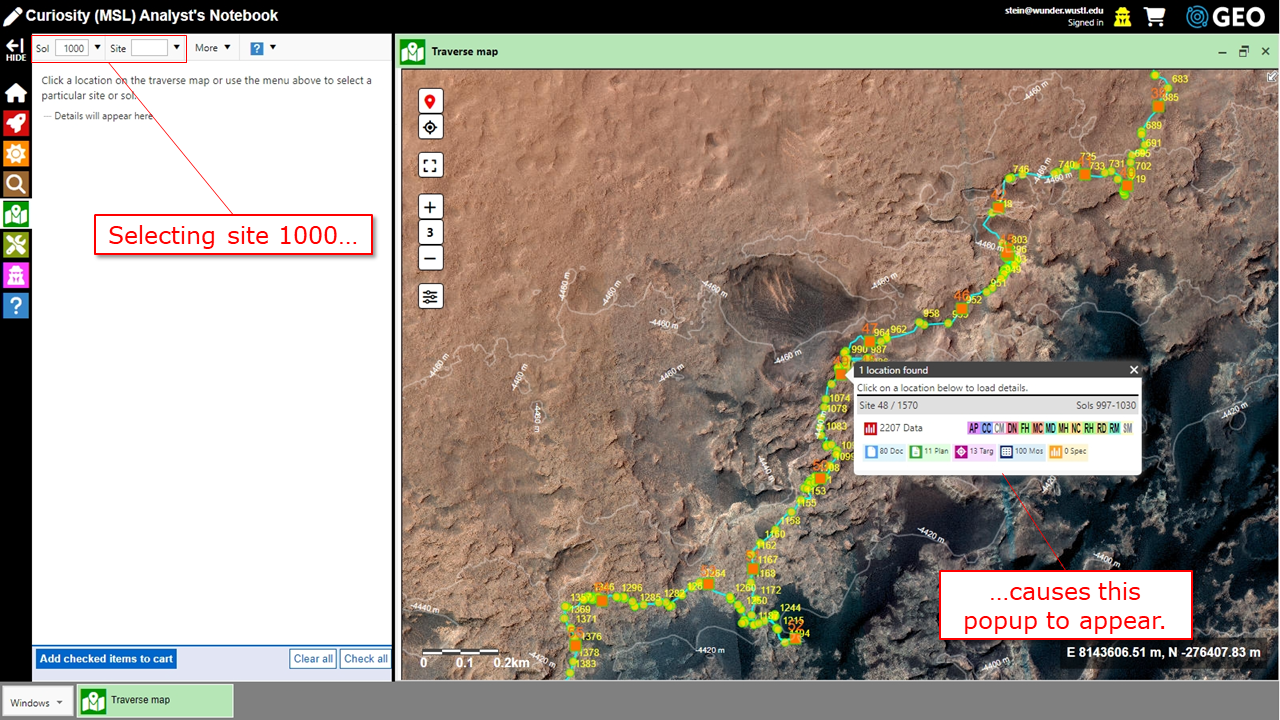
- Use the Go to site and Go to sol drop downs on the menu bar.
Linking to data products
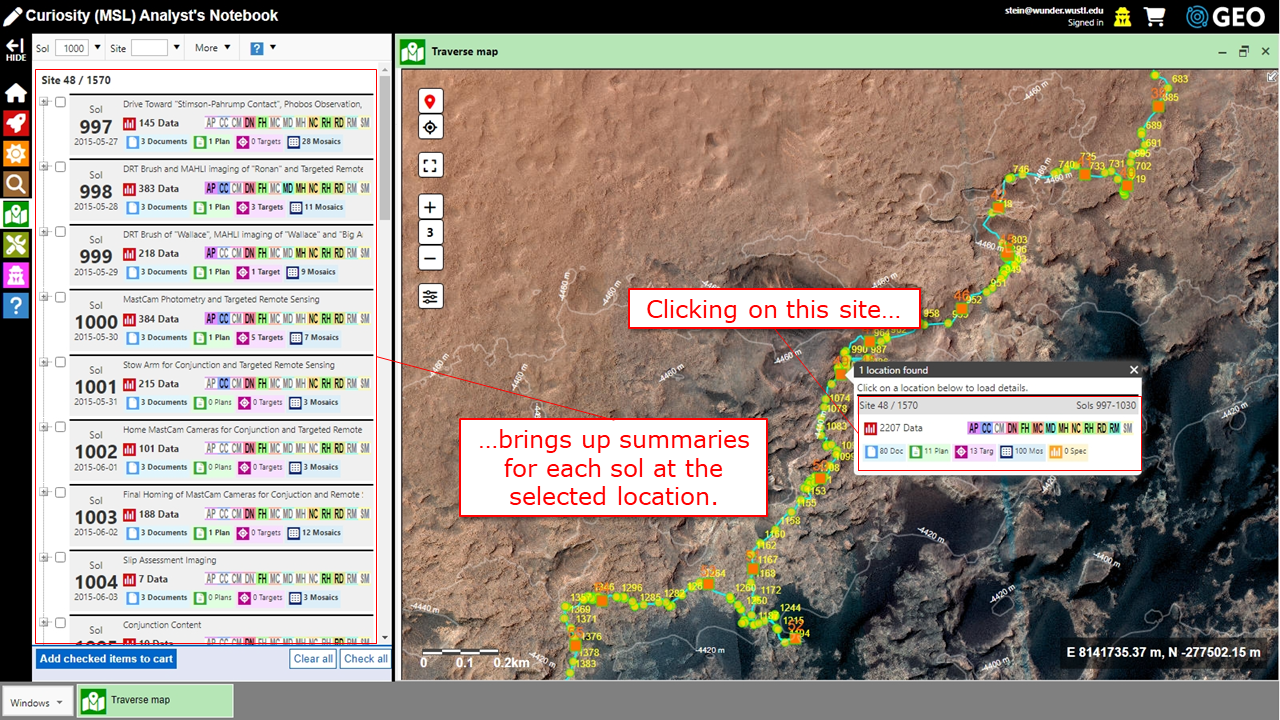
Click on a marker to see a snapshot of what's available at that location. For the Mars rovers, you might try using the Go to site/sol drop downs if your coordination is not so hot—you have to click pretty close to the center of the red marker. When you click on a marker, a popup will show a summary of one or more locations at that spot. You'll see the site/drive, the sol(s) when the rover was there, and a synopsis of the data, documentation, etc. that's available (see image below).
Click on the summary and the results will appear in the Location panel to the left (see image below). This should look familiar—it's pretty much what you see in the sol summary listings. From here, you can access the data and such for the current location.
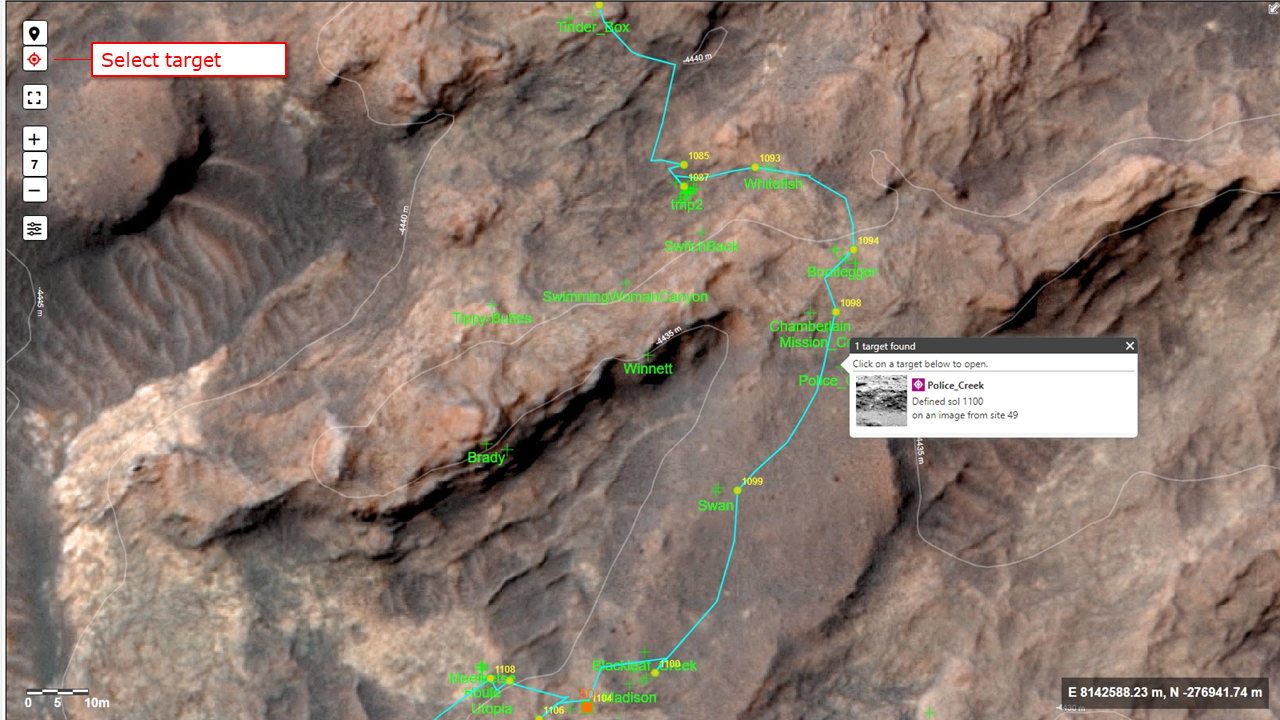
Science target and sample collection layers
mission specific
M20Applies to the
Mars 2020 ANMERApplies to the
MER ANMSLApplies to the
MSL AN
Additional layers are available for some missions. The Spirit, Opportunity, and Curiosity maps show science targets when zoomed in closely. Click on the Select target button (see image below) and then click on a target to popup a link for full details. The Mars 2020 map has a layer showing sample collection locations and the Three Forks Sample Depot. Individual targets and samples can be selected for further information and links.
Changing the map appearance
mission specific
M20Applies to the
Mars 2020 ANMERApplies to the
MER ANMSLApplies to the
MSL AN
You can change the appearance of map layers in the Perseverance, Curiosity, Opportunity, and Spirit Notebooks. Click the Settings button in the map's upper left corner to access controls for changing layer visibility and appearance (color, text size, symbols, etc.). Click the Settings button again to hide the controls. Note that some annotation layers, like sol numbers, only appear as the map is zoomed into higher resolutions.
Obtaining rover drive telemetry source data and maps
M20Applies to the
Mars 2020 ANMERApplies to the
MER ANMSLApplies to the
MSL AN
Rover position and traverse location data can be downloaded by following the named link in the Resources tab. Data for Mars 2020 and MSL are from the respective archive data sets. The traverse data for MER are derived from the archived Rover Motion Counter data sets, both available from the Resources.
How the traverse map is made
mission specific
The background image is clipped from the LRO LROC NAC high-resolution controlled mosaics. Images were produced using USGS ISIS by the LROC team at Arizona State University. Traverse lines are from Phil Stooke, University of Western Ontario. They was created by tracing tracks visible in the LROC data as well as using surface photos and descriptions.
The basemap is based on HiRISE mosaic JEZ_hirise_soc_007_orthoMosaic_25cm_Ortho_blend120 . The traverse locations are provided by the science team. The DTM is based on JEZ_hirise_soc_006_DTM_MOLAtopography_DeltaGeoid_1m_Eqc_latTs0_lon0_blend40.tif .
Spirit Rover
Color Basemap
The Spirit (MER-A) color basemap is created by using and a CRISM MTRDR and HiRISE orthoimage using ArcGIS and ENVI.
| Data source |
Multiple HiRISE images cover MERA traverse. PSP_001777_1650_RED_A_01_ORTHO (https://www.uahirise.org/dtm/PSP_001513_1655 ) is used as the base image. The three RGB bands displayed in the CRISM MTRDR image used in the basemap frt000035d0_07_if164j_mtr3 (https://ode.rsl.wustl.edu/mars/productPageAtlas.aspx?product_id=FRT000035D0_07_IF164J_MTR3&product_idGeo=26445814 ) are 41, 122, and 304. |
|
| Processing |
Both HiRISE orthoimage and CRISM MTRDR are cropped to a portion that covers the entire Spirit traverse. The three CRISM MTRDR bands are then exported in ENVI as a RGB image. After being georeferenced to the HiRISE basemap, the RGB image is then fused with the HiRISE basemap using ENVI "Gram-Schmidt Pan Sharpening" tool with the IHS (Intensity, Hue, and Saturation color space) option. |
|
|
Output |
The final MERA color basemap is re-projected to a customized map projection and has the following spatial characteristics | |
| Size | 13818 by 11465 pixels | |
| Coordinate System (WKT) |
PROJCS["Equirectangular_MARS",GEOGCS["GCS_MARS",DATUM["D_Mars_2000",SPHEROID["Mars_2000_IAU_IAG",3396190.0,169.8944472236118]],PRIMEM["Reference_Meridian",0.0],UNIT["Degree",0.0174532925199433]],PROJECTION["Plate_Carree"],PARAMETER["false_easting",0.0],PARAMETER["false_northing",0.0],PARAMETER["central_meridian",175.5],PARAMETER["scale_factor",1.0],UNIT["Meter",1.0]] |
|
| Pixel Size | 0.253 m by 0.253 m | |
| Corner Coordinates |
Upper Left (-1610.4238, -862774.9736) (175d28'22.208"E, 14d33'19.931"S) |
|
|
Lower Left (-1610.4238, -865671.437) (175d28'22.208"E, 14d36'15.855"S) |
||
|
Upper Right (1880.491, -862774.9736) (175d31'54.21"E, 14d33'19.931"S) |
||
|
Lower Right (1880.491, -865671.437) (175d31'54.21"E, 14d36'15.855"S) |
||
DEM
| Data source | MERA DEM uses HiRISE DEM DTEEC_001513_1655_001777_1650_U01 (https://www.uahirise.org/dtm/PSP_001513_1655 ). | |
| Processing |
The HiRISE DEM is clipped to the same extent as the MERA basemap (noted above) |
|
|
Output |
The final MERA DEM is re-projected to a customized map projection and has the following spatial characteristics | |
| Size | 3482 by 2889 pixels | |
| Coordinate System (WKT) |
PROJCS["Equirectangular_MARS",GEOGCS["GCS_MARS",DATUM["D_Mars_2000",SPHEROID["Mars_2000_IAU_IAG",3396190.0,169.8944472236118]],PRIMEM["Reference_Meridian",0.0],UNIT["Degree",0.0174532925199433]],PROJECTION["Plate_Carree"],PARAMETER["false_easting",0.0],PARAMETER["false_northing",0.0],PARAMETER["central_meridian",175.5],PARAMETER["scale_factor",1.0],UNIT["Meter",1.0]] |
|
| Pixel Size | 1.003 m by 1.003 m | |
| Corner Coordinates |
Upper Left (-1610.4238, -862774.9736) (175d28'22.208"E, 14d33'19.931"S) |
|
|
Lower Left (-1610.4238, -865671.437) (175d28'22.208"E, 14d36'15.855"S) |
||
|
Upper Right (1880.491, -862774.9736) (175d31'54.21"E, 14d33'19.931"S) |
||
|
Lower Right (1880.491, -865671.437) (175d31'54.21"E, 14d36'15.855"S) |
||
Opportunity Rover
Color Basemap
The Opportunity (MER-B) color basemap is created by Tim Parker (Timothy.J.Parker@jpl.nasa.gov) and Fred Calef III (Fred.Calef@jpl.nasa.gov) using ISIS v3, ArcGIS v10, and Photoshop CS5.
| Data source | HRSC and HiRISE images that cover MERB traverse. These include H3220_0001_RE4.tif (MEX HRSC red band), H3220_0001_GR4.tif (MEX HRSC green band), and H3220_0001_BL4.tif (MEX HRSC blue band), and a HiRISE mosaic: MER_Meridianni_Endeavor_Basemap_25cm.tif. Detailed information about the HiRISE basemap can be found at the following link: (https://pdsimage2.wr.usgs.gov/pub/pigpen/mars/hirise/MER_mosaics/MER_Meridianni_Endeavor_Basemap_25cm_README.txt ). | |
| Processing |
The three HRSC bands are combined into a RGB image which is then fused with the HiRISE basemap using ArcPro v3 "Create Pansharpened Raster Dataset" with the IHS (Intensity, Hue, and Saturation color space) option. The image is then manually stretched to remove some of the blue component in the HRSC image to get closer to the Mars colors seen in CRISM RGB and HiRISE RGB images in the area. |
|
|
Output |
The MERB color basemap (MER_Oppy_HiRISE_Basemap_pansharp_H3220_0001_RGB_25cm.tif) is reprojected to a customized map projection and has the following spatial characteristics: |
|
| Size | 162949 by 224000 pixels | |
| Coordinate System (WKT) |
PROJCS["MerB_point",GEOGCS["GCS_Mars_2000_Sphere",DATUM["D_Mars_2000_Sphere",SPHEROID["Mars_2000_Sphere_IAU_IAG",3396190.0,0.0]],PRIMEM["Reference_Meridian",0.0],UNIT["Degree",0.0174532925199433]],PROJECTION["Transverse_Mercator"],PARAMETER["false_easting",0.0],PARAMETER["false_northing",0.0],PARAMETER["central_meridian",-5.525785],PARAMETER["scale_factor",1.0],PARAMETER["latitude_of_origin",-1.9487931],UNIT["Meter",1.0]] |
|
| Pixel Size | 0.25 m by 0.25 m | |
| Corner Coordinates |
Upper Left (-3055.375, 1787.125) (5d37'4.48"W, 1d53'22.23"S) |
|
|
Lower Left (-3055.375, -25009.299) (5d37'4.48"W, 2d50'3.34"S) |
||
|
Upper Right (16948.881, 1787.125) (4d55'50.34"W, 1d53'22.23"S) |
||
| Lower Right (16948.881, -25009.299) (4d55'50.34"W, 2d50'3.34"S) | ||
DEM
| Data source | There are two available HiRISE DEMs from the HiRISE website which covers a portion of Opportunity’s traverse: dteec_021747_1780_022380_1780_u01 (https://www.uahirise.org/dtm/dtm.php?ID=ESP_021747_1780 ); dteec_018701_1775_018846_1775_U01 (https://www.uahirise.org/dtm/dtm.php?ID=ESP_018701_1775 ). Both DEMs have 1 m/pixel resolution. Additional HiRISE images were used to fill in gaps: ESP_011765_1780 (https://www.uahirise.org/ESP_011765_1780 ) and ESP_012820_1780 (https://www.uahirise.org/ESP_012820_1780 ); and ESP_021536_1780 (https://www.uahirise.org/ESP_021536_1780 ) and ESP_028459_1780 (https://hirise.lpl.arizona.edu/ESP_028459_1780 ). | |
| Processing |
Low-resolution MOLA topo elevation data obtained through an ODE MOLA PEDR query are used as control points for all DEMs. The resolution of MOLA points is only 300 m/pixel. Therefore, a CTX stereo pair at 6 m/pixel is used to provide an intermediate DEM reference: B08_012754_1779_XN_02S005W (http://viewer.mars.asu.edu/planetview/inst/ctx/B08_012754_1779_XN_02S005W ) and B08_012820_1779_XN_02S005W (http://viewer.mars.asu.edu/planetview/inst/ctx/B08_012820_1779_XN_02S005W ). Following the Ames Stereo Pipeline instruction [Ref. 1], a CTX DEM is created using the CTX stereo pair. This CTX DEM is then refined to align with the MOLA control points. The refined CTX DEM is used as the control DEM for the HiRISE DEMs. The two HiRISE DEMs are created using Ames Stereo Pipeline and then aligned to the CTX DEM. The HiRISE DEMs’ corresponding ortho images are rectified to the MERB color basemap in ArcGIS. These transformations are also applied to each HiRISE DEMs to rectify to the basemap. Finally, each rectified DEM is assembled into a mosaic in ArcGIS. |
|
|
Output |
The MERB DEM (mosdem_basemap_extent.tif) has the following spatial characteristics | |
| Size | 20005 by 26797 pixels | |
| Coordinate System (WKT) |
PROJCS["MerB_point",GEOGCS["GCS_Mars_2000_Sphere",DATUM["D_Mars_2000_Sphere",SPHEROID["Mars_2000_Sphere_IAU_IAG",3396190.0,0.0]],PRIMEM["Reference_Meridian",0.0],UNIT["Degree",0.0174532925199433]],PROJECTION["Transverse_Mercator"],PARAMETER["false_easting",0.0],PARAMETER["false_northing",0.0],PARAMETER["central_meridian",-5.525785],PARAMETER["scale_factor",1.0],PARAMETER["latitude_of_origin",-1.9487931],UNIT["Meter",1.0]] |
|
| Pixel Size | 0.999 m by 0.999 m | |
| Corner Coordinates |
Upper Left (-3055.375, 1787.125) (5d37'4.48"W, 1d53'22.23"S) |
|
|
Lower Left (-3055.375, -25009.299) (5d37'4.48"W, 2d50'3.34"S) |
||
|
Upper Right (16948.881, 1787.125) (4d55'50.34"W, 1d53'22.23"S) |
||
| Lower Right (16948.881, -25009.299) (4d55'50.34"W, 2d50'3.34"S) | ||
[1]. Beyer, Ross A., Oleg Alexandrov, and Scott McMichael. 2018. The Ames Stereo Pipeline: NASA’s open source software for deriving and processing terrain data. Earth and Space Science, 5. https://doi.org/10.1029/2018EA000409
The base map is a subset of the Gale_C_PSP_010573_1755_010639_1755_25cm image georeferenced by Tim Parker and Fred Calef for their localization activities. The traverse is generated by applying the best_tactical places solution updates to the raw rover telemetry.
see also